Regression#
A command to run supervised regression analysis on the SPARK dataset.
Introduction#
Many instruments in SPARK are behavioural questionnaires that have a set of question features and a single score feature. We investigate whether the score feature of one instrument can be predicted from the question features of another instrument. Strong predictability would suggest common latent traits, while poor predictability would indicate instrument-specific variance and provide evidence for ASD heterogeneity.
Methods#
The instruments under analysis include:
Repetitive Behavior Scale - Revised (
RBSR)Developmental Coordination Disorder Questionnaire (
DCDQ)Child Behavior Checklist for ages 6 to 18 years (
CBCL_6_18)Social Communication Questionnaire (
SCQ)
The inclusion criteria for these instruments include:
Each instrument must have a 1 score feature used as the target for regression.
Each instrument must have a n question features used as the input for regression.
The regression implementations used include:
The sample size for each regression is determined by the number of subjects that have both the question features and the score feature available. The number of subjects used in each regression is shown below:
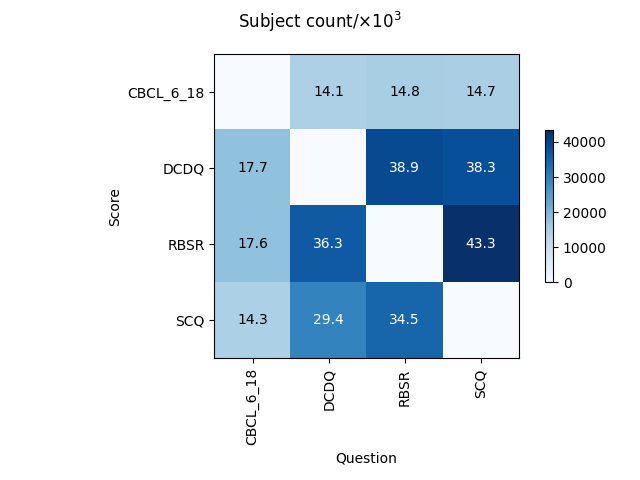
A heatmap showing the number of subjects used in each regression. The x-axis corresponds to the instrument providing question features and the y-axis corresponds to the instrument whose score feature is being predicted.#
K-fold cross-validation with \(k = 5\) is used to evaluate \(R^2\) values. 95% confidence intervals are calculated using the Student’s t-distribution with degrees of freedom equal to \(k - 1 = 4\).
Results#
The results are plotted below:
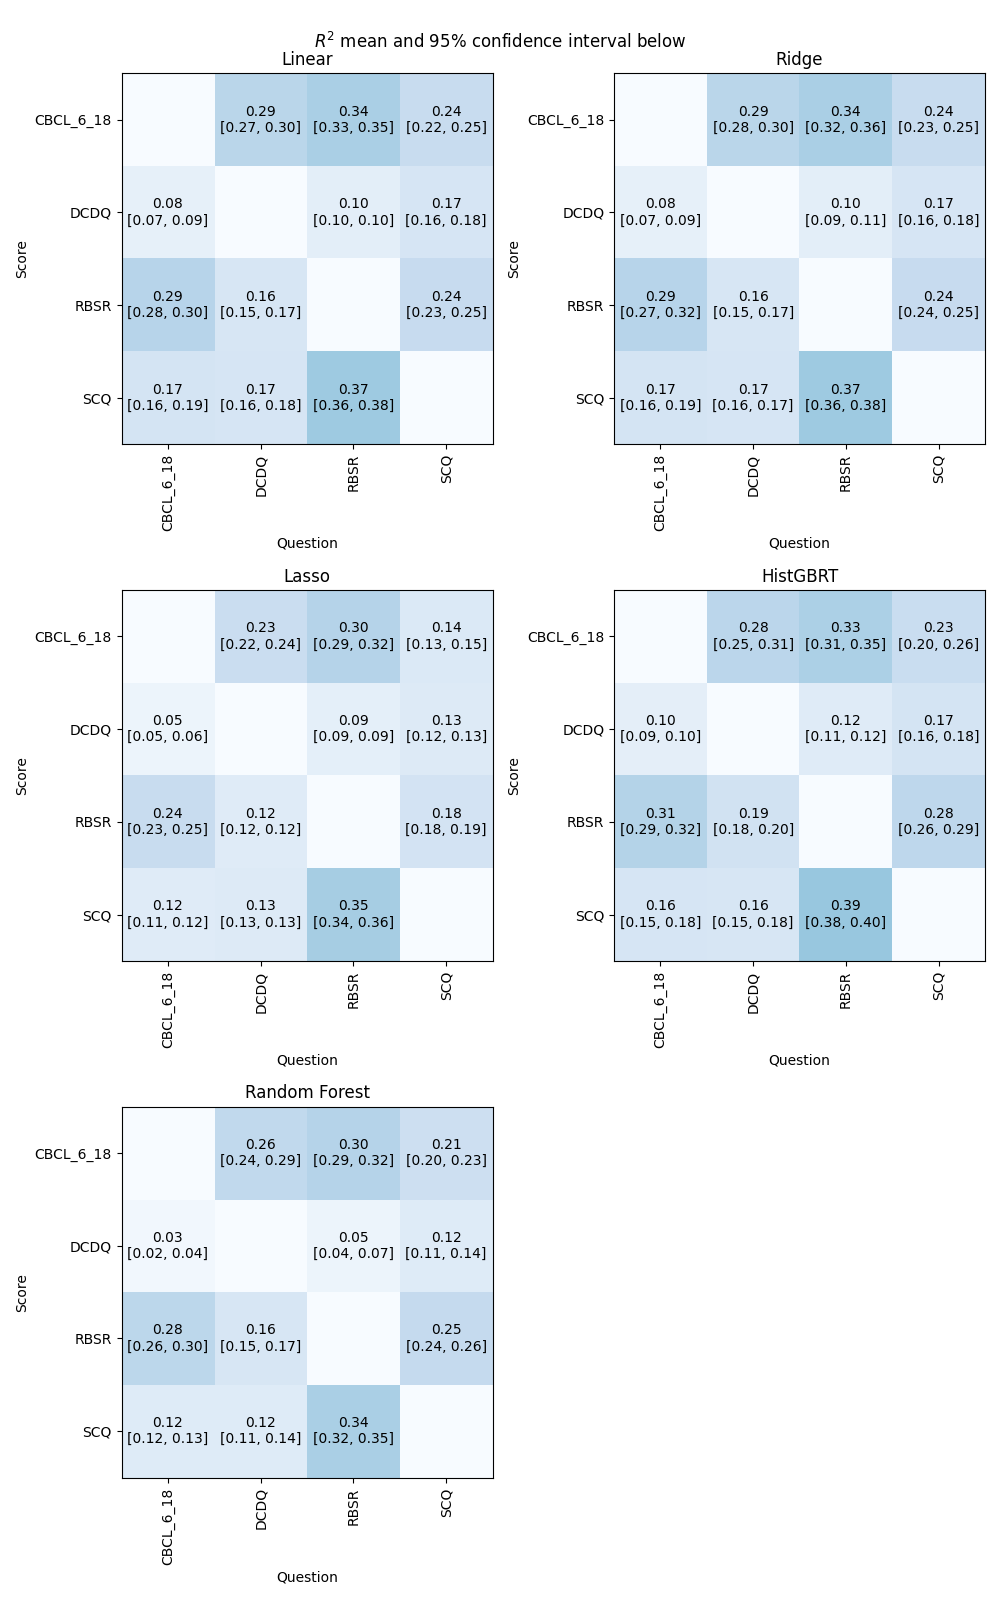
A grid of heatmaps showing regression performance. Each heatmap displays the mean \(R^2\) values for a specific model, where the x-axis corresponds to the instrument providing question features and the y-axis corresponds to the instrument whose score feature is being predicted.#
The largest mean \(R^2\) values are observed when:
predicting the SCQ final score using the questions from RBS-R (\(R^2=0.39\), 95% CI [0.38, 0.40] using histogram-based gradient boosting regression tree); and
predicting the CBCL/6-18 final score using the questions from RBS-R (\(R^2=0.34\), 95% CI [0.33, 0.35] using linear regression).
Discussion#
The regression results indicate that instrument questions struggle to predict scores of other instruments. Non-linear regression models do not perform better than linear regression models. The low mean \(R^2\) values supports the view that ASD is a heterogeneous condition, which motivates our unsupervised analysis.
Module contents#
- asd_strat.commands.regression.plot_regression_results(instruments: list[Inst], r2_mean: dict[str, ndarray], r2_ci_lower: dict[str, ndarray], r2_ci_upper: dict[str, ndarray], models: dict[str, Any], nrows: int = 5, ncols: int = 1, figsize: tuple[int, int] = (6, 20)) Figure#
Plots a grid of heatmaps. Each heatmap plots the regression results for a model. Each cell is coloured based on the mean \(R^2\) achieved by the model when tasked with using the x-axis instrument’s question features to predict the y-axis instrument’s score.
- Parameters:
instruments – The instruments under analysis.
r2_mean – A dictionary of \(R^2\) matrices keyed by a model.
r2_ci_lower – A dictionary of \(R^2\) confidence interval lower bound matrices keyed by a model.
r2_ci_upper – A dictionary of \(R^2\) confidence interval upper bound matrices keyed by a model.
models – The models used for analysis.
nrows – The number of rows in the heatmap grid.
ncols – The number of columns in the heatmap grid.
figsize – The size of the figure.
- Returns:
The plotted figure.
- asd_strat.commands.regression.plot_subject_counts(instruments: list[Inst], subject_counts: ndarray) Figure#
Plots a heatmap of subject counts for each combination of instruments.
- Parameters:
instruments – A list of instruments used in the analysis.
subject_counts – A 2-dimensional array where each cell represents the number of subjects for the corresponding instrument pair.
- Returns:
- asd_strat.commands.regression.regression(spark_pathname: ~typing.Annotated[str, <typer.models.ArgumentInfo object at 0x7f26fb8c3890>] = '.', cache_pathname: ~typing.Annotated[str, <typer.models.ArgumentInfo object at 0x7f26fb8c39d0>] = '.', output_pathname: ~typing.Annotated[str, <typer.models.ArgumentInfo object at 0x7f26fb8c3b10>] = '.') None#
Perform regression analysis using multiple models on specified instruments.
Saves the plot of regression results to disk.
- Parameters:
spark_pathname – The SPARK data release directory pathname.
cache_pathname – The cache pathname.
output_pathname – The output pathname.
- asd_strat.commands.regression.run_regression(spark_pathname: str, models: dict[str, Any], instruments: list[Inst], kf=KFold(n_splits=5, random_state=None, shuffle=True)) tuple[dict[str, ndarray], dict[str, ndarray], dict[str, ndarray], ndarray]#
Executed regression analysis for each combination of instruments and models provided, evaluating the cross-validation mean \(R^2\), confidence interval lower and upper bounds, and subject counts.
- Parameters:
kf – A K-Fold cross-validator.
spark_pathname – The SPARK data release pathname.
models – A dictionary of models keyed by their name.
instruments – A list of instruments to carry out regression on.
- Returns:
A dictionary of \(R^2\) matrices keyed by model, a dictionary of confidence interval lower bounds keyed by model, a dictionary of confidence interval upper bounds keyed by model, and a matrix of subject counts.